
Statistics Formula Cheat Sheet
| Topic | Formula | Description |
|---|---|---|
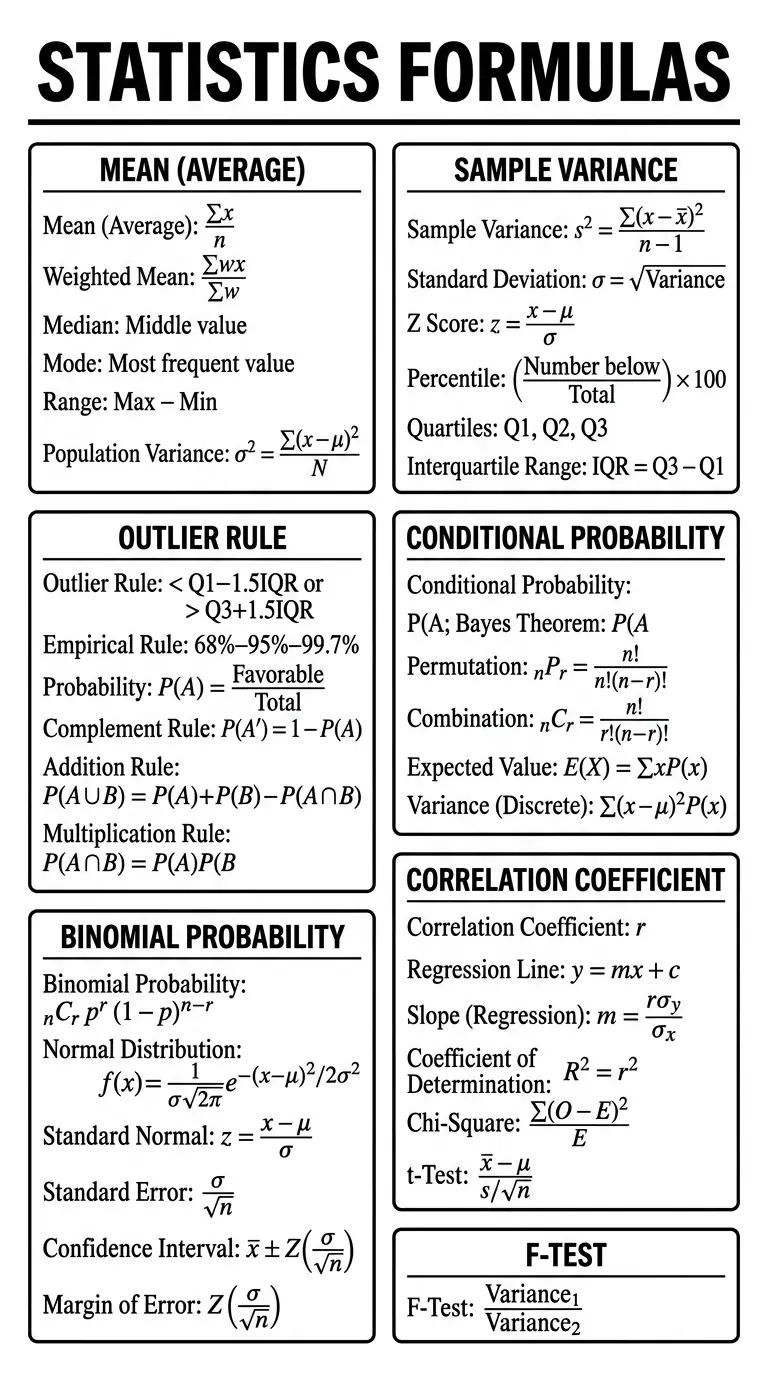
| Mean (Average) | (Σx)/n | Sum of values divided by count |
| Weighted Mean | (Σwx)/(Σw) | Mean with weights |
| Median | Middle value | Central value in ordered data |
| Mode | Most frequent value | Highest frequency |
| Range | Max − Min | Spread of data |
| Population Variance | σ² = Σ(x−μ)² / N | Spread of population |
| Sample Variance | s² = Σ(x−x̄)² / (n−1) | Spread of sample |
| Standard Deviation | σ = √Variance | Dispersion measure |
| Z Score | z = (x−μ)/σ | Standardized value |
| Percentile | (Number below / Total) × 100 | Position measure |
| Quartiles | Q1, Q2, Q3 | Data division |
| Interquartile Range | IQR = Q3 − Q1 | Middle spread |
| Outlier Rule | < Q1−1.5IQR or > Q3+1.5IQR | Detect outliers |
| Empirical Rule | 68%–95%–99.7% | Normal distribution |
| Probability | P(A) = Favorable/Total | Basic probability |
| Complement Rule | P(A′) = 1 − P(A) | Opposite event |
| Addition Rule | P(A∪B) = P(A)+P(B)−P(A∩B) | Combined events |
| Multiplication Rule | P(A∩B) = P(A)P(B | A) |
| Conditional Probability | P(A | B) = P(A∩B)/P(B) |
| Bayes Theorem | P(A | B) = [P(B |
| Permutation | nPr = n!/(n−r)! | Ordered selection |
| Combination | nCr = n!/[r!(n−r)!] | Unordered selection |
| Expected Value | E(X) = ΣxP(x) | Mean outcome |
| Variance (Discrete) | Σ(x−μ)²P(x) | Spread measure |
| Binomial Probability | nCr pʳ (1−p)ⁿ⁻ʳ | Success probability |
| Normal Distribution | f(x)=1/(σ√2π)e^(-(x−μ)²/2σ²) | Bell curve |
| Standard Normal | z = (x−μ)/σ | Normalized value |
| Standard Error | σ/√n | Sampling variability |
| Confidence Interval | x̄ ± Z(σ/√n) | Estimate range |
| Margin of Error | Z(σ/√n) | Error range |
| Correlation Coefficient | r | Strength of relation |
| Regression Line | y = mx + c | Best fit line |
| Slope (Regression) | m = r(σy/σx) | Rate of change |
| Coefficient of Determination | R² = r² | Explained variance |
| Chi-Square | Σ(O−E)²/E | Test statistic |
| t-Test | (x̄−μ)/(s/√n) | Hypothesis test |
| F-Test | Variance₁/Variance₂ | Compare variances |
Visited 3 times, 1 visit(s) today