
Trigonometric functions can be plotted using a number of different techniques, and understanding how to graph a trig function them accurately and efficiently is a critical skill for students, scientists, and engineers.
Other Trigonometry lessons include:- How to Find Angle In Trigonometry
How to Graph a Trig Function with Examples
Trigonometry functions are essential to understand before proceeding. The main trigonometric functions are sine (sin), cosine (cos), tangent (tan), cosecant (csc), secant (sec), and cotangent (cot). These functions are defined based on ratios of sides in a right triangle.
Sine represents the ratio of the side opposite an angle to the hypotenuse. Cosine represents the ratio of the adjacent side to the hypotenuse. Tangent represents the ratio of the opposite side to the adjacent side.
To graph a trigonometric function, we start with key points and connect them. The unit circle, with a radius of one unit, is useful for calculating function values at common angles like 0°, 30°, 45°, 60°, and 90°.
For graphing sine or cosine, we find the y-coordinate using the function’s value for a given x-coordinate. For instance, y = sin(x) gives the y-coordinate for a given x-coordinate when graphing the sine function.
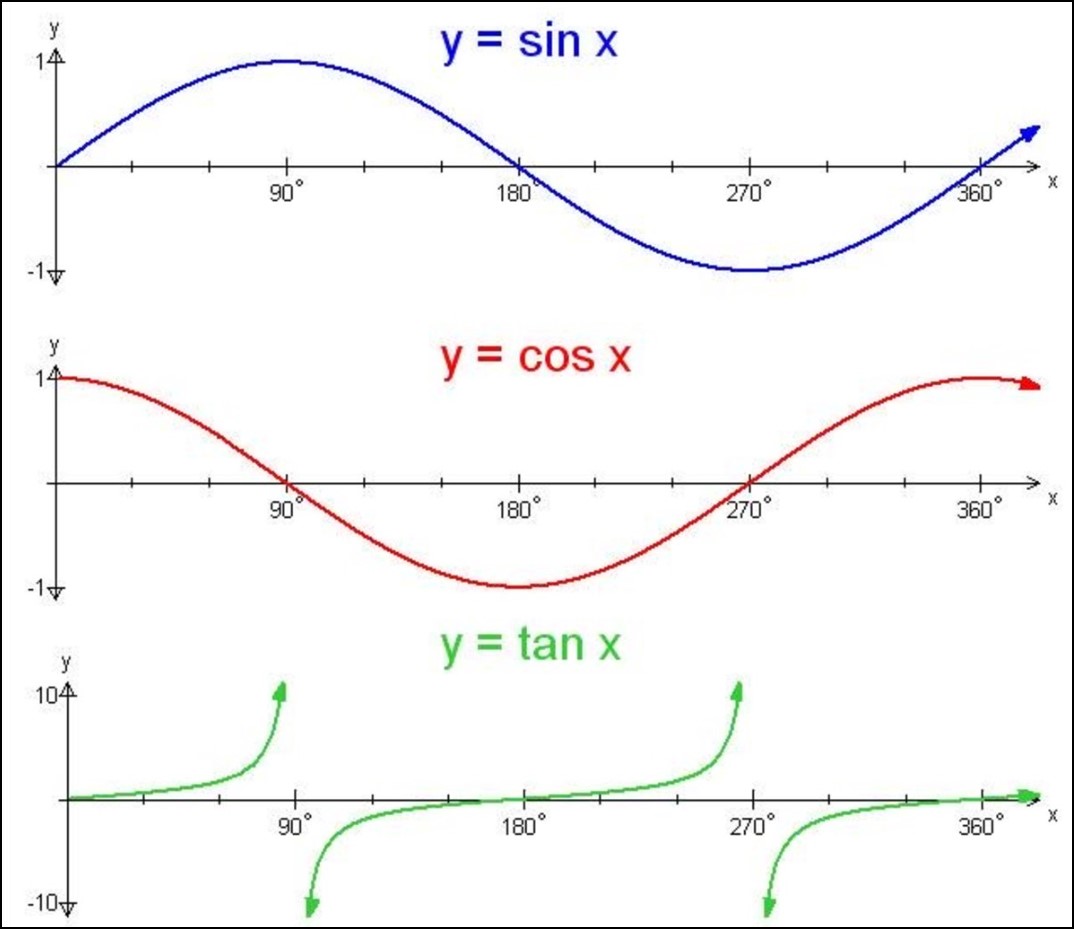
To begin the graph, we find the y-coordinate at x = 0, known as the y-intercept. For the sine function, the y-intercept is 0, while for the cosine function, it’s 1.
Next, we determine the maximum and minimum values. For sine, the maximum is 1, and the minimum is -1. For cosine, both maximum and minimum are 1 and -1, respectively.
Using these points, we create a rough sketch. The sine function oscillates between its maximum and minimum, passing through 0 at x = 0, x = 180°, x = 360°, and so on. The cosine function starts at 1, drops to 0 at x = 90°, and oscillates between 0 and -1.
To refine the graph, we calculate more y-coordinates using the unit circle for specific x-coordinates like 0°, 30°, 45°, 60°, and 90°. This provides a better understanding of the graph’s shape.
Graphing Trig Functions
Graphing trigonometric functions is an important aspect of understanding and visualizing the behavior of these functions. Trigonometric functions such as sine, cosine, and tangent have distinct patterns and properties that can be represented graphically. By plotting these functions on a graph, we can gain insights into their periodic nature, maximum and minimum values, and how they relate to angles and triangles.
To graph a trigonometric function, we first determine the key points that define its shape. These points often correspond to specific angles such as 0 degrees, 30 degrees, 45 degrees, and so on. By evaluating the function at these angles, we can find the corresponding y-coordinates and plot the points on a coordinate plane.
The unit circle is a useful tool for graphing trigonometric functions. It provides a visual representation of angles in the form of a circle with a radius of one unit. By mapping angles to points on the unit circle, we can easily determine the sine and cosine values for those angles. This information helps us construct accurate graphs for these functions.
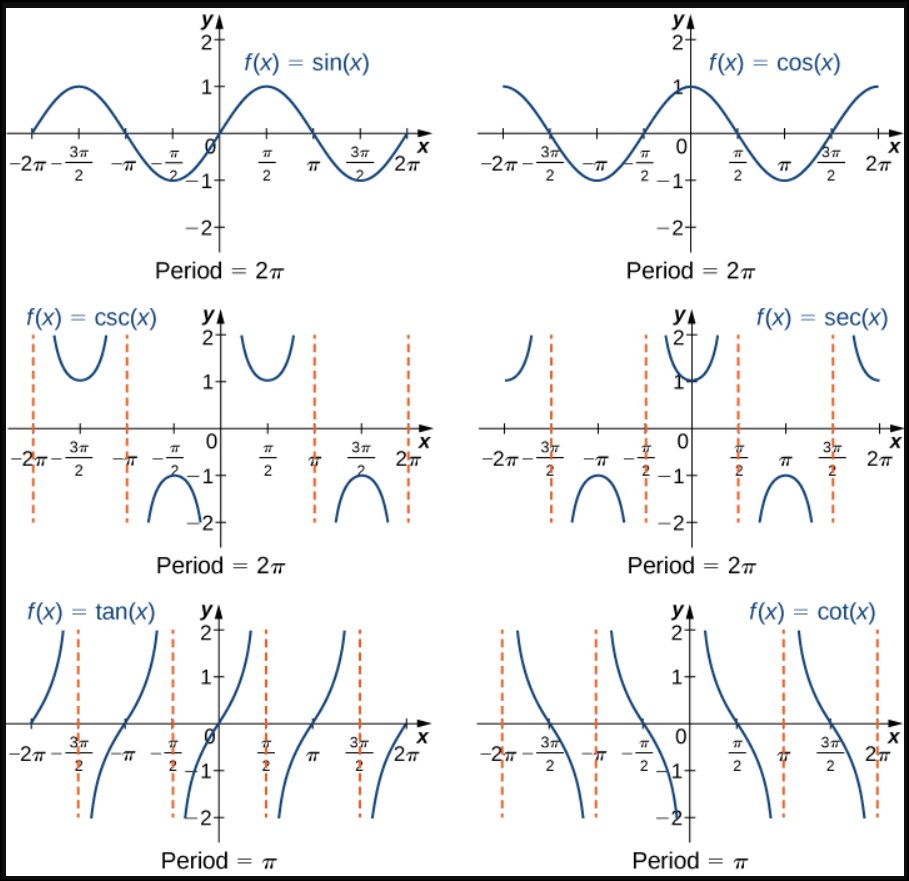
The sine function (sin) is a periodic function that oscillates between values of -1 and 1. Its graph resembles a smooth wave-like pattern, passing through the x-axis at the origin (0, 0) and repeating its shape every 360 degrees or 2π radians. The maximum and minimum points of the sine function occur at intervals of 180 degrees or π radians.
How to Graph a Trigonometry
To graph a trigonometric function, follow these steps:
- Understand the basic trigonometry functions. Familiarize yourself with the six main trigonometric functions: sine (sin), cosine (cos), tangent (tan), cosecant (csc), secant (sec), and cotangent (cot). These functions are defined based on ratios of sides in a right triangle.
- Determine the key points. Identify important points on the graph, such as the y-intercept, maximum values, minimum values, and points of symmetry. The y-intercept is the value of the function when x = 0, and the maximum and minimum values represent the highest and lowest points on the graph, respectively.
- Plot the initial sketch. Start by plotting the y-intercept and the maximum and minimum values on the graph.
- Determine the period. The period is the length of one complete cycle of the graph. It depends on the specific trigonometric function and is often related to angles, such as 360 degrees or 2π radians. Understanding the period helps in accurately drawing the graph.
- Use symmetry to plot more points. Trigonometric functions often exhibit symmetry, such as being even (symmetric about the y-axis) or odd (symmetric about the origin).
- Refine the graph using the unit circle. To make the graph more precise, use the values from the unit circle for common angles like 0°, 30°, 45°, 60°, and 90°.
- Connect the plotted points. Once you have several points on the graph, connect them smoothly to create a continuous curve.
- Consider amplitude and phase shift. Depending on the function, you may need to adjust the amplitude (vertical scaling) and phase shift (horizontal translation) of the graph.
- Use technology for accuracy. While manual graphing is educational, technology can provide more precise graphs.
By following these steps and practicing with various trigonometric functions, you can become proficient in graphing them and visually understanding their behavior and patterns.